blog · February 3, 2026
The world is more equal than you think
By The Economist (using WDL data)
An Economist analysis of newly released WDL data covering 194 economies shows that the spending ratio between the world's richest 10% and poorest 50% has more than halved since 2000.
Originally published in The Economist's Graphic Detail. Summary: at first glance the global economy looks more uneven than ever — billionaire fortunes keep breaking records, asset prices have soared and voters in rich countries insist life is getting harder. Yet the underlying spending data tells a different story.
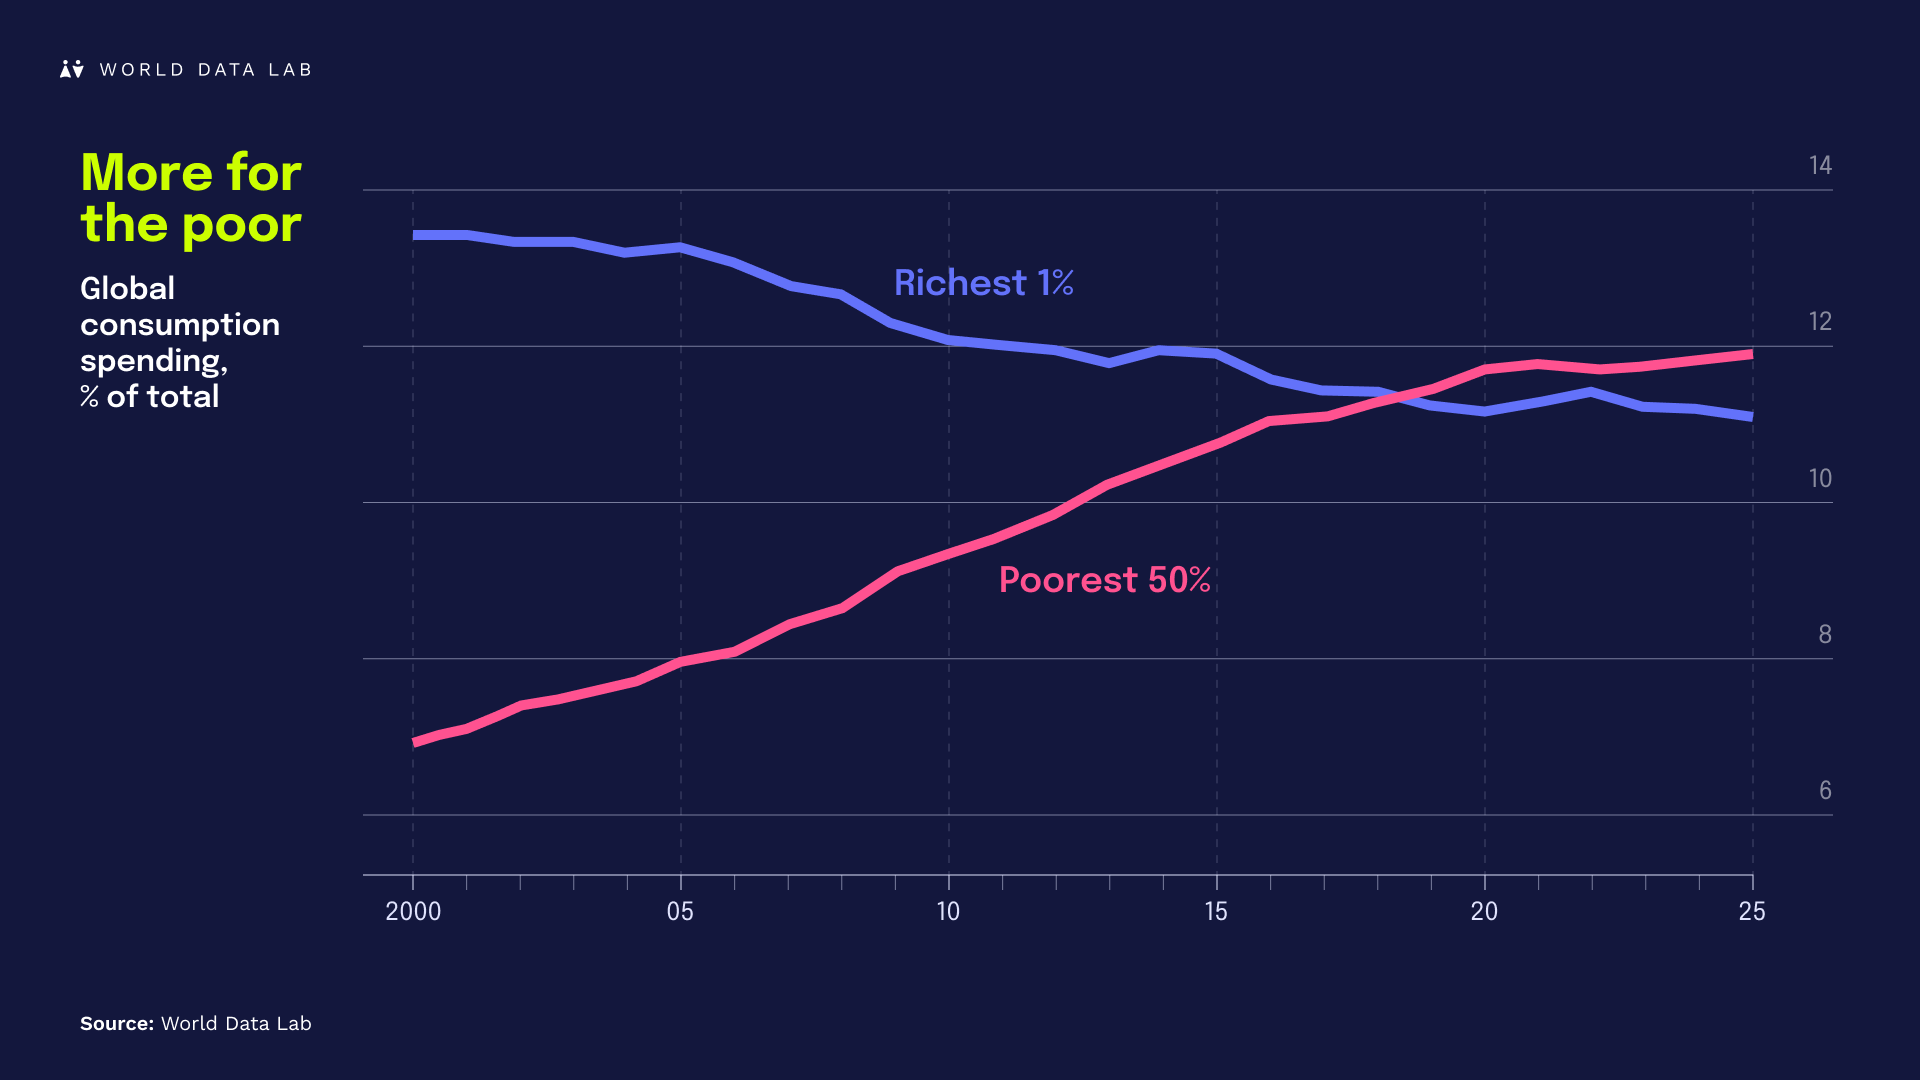
Data released on 20 January 2026, covering 194 countries and economies and compiled by World Data Lab, show that the ratio between spending by the world's richest 10% and the poorest 50% has more than halved since 2000. The rich used to spend about 40 times more than the poor; today the figure is closer to 18. Over the same period the share of consumption held by the richest 1% has also shrunk.
The shift is driven mostly by gains in low- and middle-income economies rather than changes in rich countries. Poorer countries have grown faster than rich ones and consumption has risen with incomes. The ratio of average American to Indian spending, for example, has more than halved over the past 25 years — from more than 16 to less than eight.
Spending inequality within countries can tell a different story: some rich countries became more unequal in the late 20th century even as global inequality fell, and in the past decade the richest 10% have pulled away from the poorest 50% in Japan, Denmark, Iceland and Sweden. But in many countries where populist politicians lament that the poor have been left behind, consumption gaps have actually narrowed — including in Spain, Greece, Britain and France.
Inequality can be gauged in different ways. On consumption, the news is mostly good.
Read the full Economist article: economist.com/graphic-detail/2026/02/03/the-world-is-more-equal-than-you-think.